 This Queensland Survey demonstrates how superficial questioning about population growth as an abstract good or ill gives a completely different response from deeper, prompted questioning on the matter of experienced impact of population growth. Deeper questioning elicits a profound rejection of population growth and the colourful graphs reflect the real trends. We publish this analysis because of the counterintuitive results of two much publicised recent Victorian polls, by Roy Morgan and by the Australian Institute of Progress. Those poll results and methods are analysed in another article, "Evaluating Surveys that find Australians want higher immigration and a bigger population.". The author would like to thank M.R. for drawing her attention to the subject of this article and for some valuable discussions.
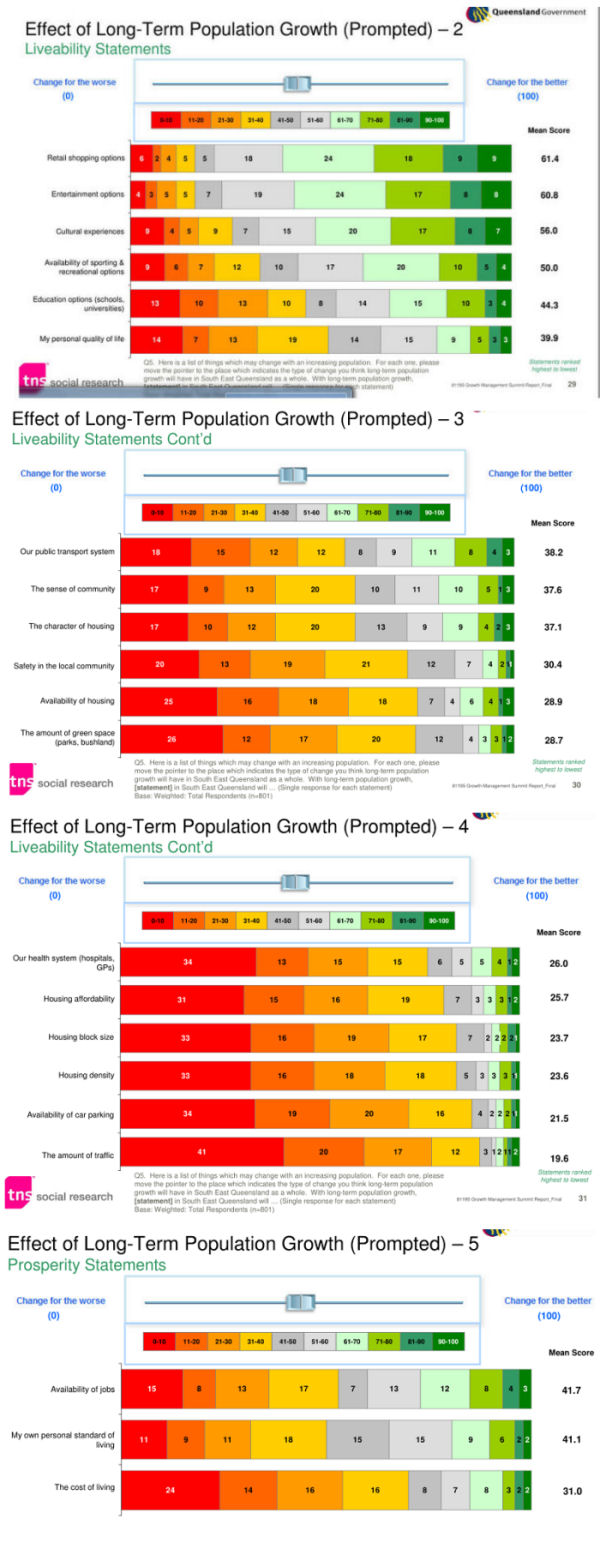
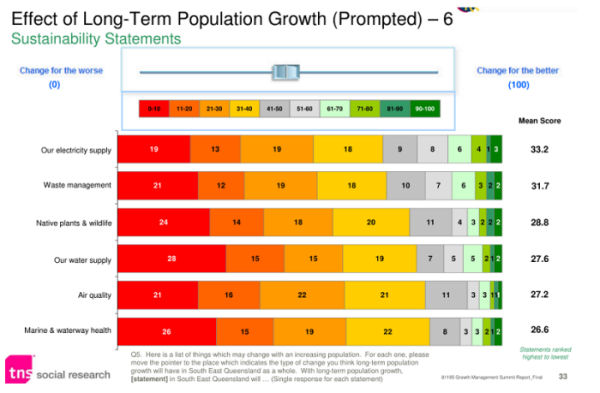
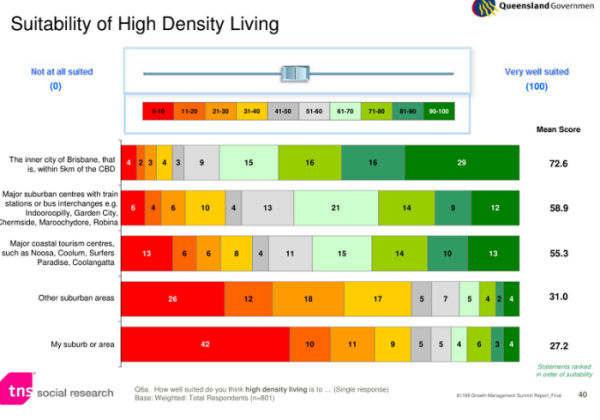 Prompted perception of impacts of population growth in South East Queensland, 2010 survey by Queensland Government
(For a larger image of the graphs, click here. Use return arrow to go back to this article.)
QUEENSLAND SURVEY ON POPULATION.
For the purposes of comparison, this Queensland Survey demonstrates how superficial questioning about population growth as an abstract good or ill gives a completely different response from deeper, prompted questioning on the matter of experienced impact of population growth. Deeper questioning elicits a profound rejection of population growth.
The name of the survey was "Queensland Growth Management Summit 2010, Social Research on Population Growth and Liveability in South East Queensland", published March 2010 [1]. This survey had 801 respondents.
The report did not make it clear to respondents that 50 per cent of Queensland’s population growth was due to overseas immigrants and thus relatively discretionary. (See graph in endnotes). [2] Although immigration (overseas and interstate) were acknowledged as components of population growth, most respondents were probably not aware of how large this discretionary component was, especially the overseas part. [3]
This report never assessed the respondents for whether they had a job or position that benefited directly from population growth – such as in development, housing finance, conveyancing, real-estate, construction, building materials supply etc. It did, however, sub-categorise people according to whether they were inner-city or retired, for instance, providing some useful nuances to the opinions elicited.
What is the difference between abstract and personally relevant (prompted) questions?
An abstract question is one that has no context or direct relationship to the person, such as, ‘Is cheesecake delicious?’ A probed question about the impact of cheese cake on respondent such as, ‘Do you benefit from eating cheesecake?” might elicit a quite different and more relevant response.
Population growth in the abstract
At the beginning the report presented responses to abstract questions on population growth and evaluated the total responses as only slightly more against population growth than for it, but close to 50:50. [3] This was misleading.
On page 24 of the report there is a presentation of how people perceive benefits to population growth. The first lines are about ‘economic benefits’. This was one of few questions that permitted the surveyors to present the responses as fairly evenly divided, [5] although they exaggerated this division on page 24 as “Opinion about population growth in South East Queensland is polarised.” Although 27% said that there was nothing positive about population growth and didn’t want a higher population in SEQ, the report led with the less well represented idea that 25% of residents cited economic benefits, “particularly in terms of increased work opportunities/ a wider skills base and stimulation of the local economy as a result of competitive businesses and property prices (23%). In fact, of retirees who responded, there was a higher negative response of 37%.
(How to read the graphs: The information presented below is pictured as a levered graphic representing a bar graph on its side. Each ‘box’ is like the top of a bar graph and indicates one group of response.)
Prompted questions reveal most people actually hate population growth
The next series of graphs (2- 5) gives a dramatically different picture because it asks people to actually think about the effect that population growth would have on specific parts of their lives. It calls for thinking based on experience, rather than a guess at whether population growth [which the media promote as a natural and inevitable thing) might represent some abstract good or bad out there in government policy and economics-land.
The graphs are coloured with red as a profound protest or “No”. We can see that as the respondents consider the effects of population growth on their own ‘livability’ they are gripped by horror.
The first in the series of “prompted” responses to “liveability statements” is the least dramatic, but as the questions get ‘closer to home’ the reds and yellows predominate. By adding up all the red-orange-yellow boxes and the first grey one, which are all ‘negative’, the responses indicate that 84% of people actually realise that population growth is bad for housing availability. When you go through this in detail, just adding things up, you get a more forcefully telling result of what peoples’ attitudes to population growth are. You have 100% answering the question of which 84% realise it’s bad for housing. The 2010 Queensland government wanted to find out how much population growth it could cram in, and, in its presentation of the report, failed to adequately acknowledge the very strong, actually overwhelming rejection of population growth on specific issues. By reporting a mean score the report obfuscated the extent of rejection, which any professional could not possibly have failed to notice. This choice not to give due weight in presenting the obvious and important cannot be accidental from professional pollsters and would fail a first year statistics report.
We are making the difference that when this report started off, 43% of responses suggested that population growth was good for the economy (a very abstract notion and a response typically preached in the mass media). But prompted questions later on revealed that 90% of respondents were against population growth and contradicted their initial superficial responses in rating population growth as an abstract value. When people were asked about effects on themselves you obtained more thoughtful responses, which concluded negative impact.
Some highlights of the Queensland report
Graph 4: In graph 4, ‘housing affordability’ runs at 90% ‘change for the worse’. Traffic congestion runs even higher!
Graph 5: In graph 5, ‘availability of jobs’: 60% think that pop growth is bad for job availability. ‘My own personal standard of living’ gets a 64% negative response. When asked about ‘cost of living’, 78%, when prompted, say that population growth is bad for cost of living.
Graph 6: For this graph, the total negatives are:
Our electricity supply 78%
Waste management 80%
Native plants and wildlife 76%
Our water supply 85%
Air quality 91%
Marine & waterway health 89%
Suitability for high density living graph: The NIMBY principle may be reflected here, giving an initial appearance of consent to high density. (See the green responses to high density in Brisbane inner city and around transport hubs.) People are less concerned if others have to suffer high density, but it that density is to happen in ‘My suburb or area’, 42% of people are saying ‘absolutely not!’ in bold red, and a total of 78% are negative to high density. The response is similarly negative towards high density for “Other Suburban areas”.
This initial misleading appearance of consent has been exploited elsewhere, where a survey might use forced choice questions to provoke most people to choose densification in other suburbs rather than their own. You could either present this as most people approve of densification in all suburbs or as most people don't approve of densification in their own suburb. To decide the truth of the matter you would need to see whether people were given a choice of selecting no new densification anywhere vs densification anywhere or everywhere. Has this Queensland Survey been similarly abused? We don’t know.
NOTES
[1] Accessible at http://www.parliament.qld.gov.au/Documents/TableOffice/TabledPapers/2010/5310T1926.pdf
[2] Queensland Population Growth Components Graph: 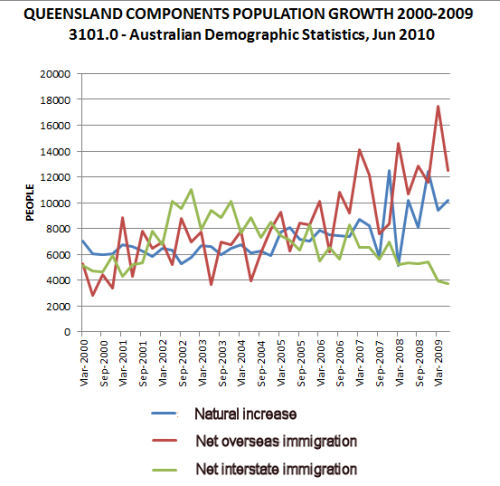
[3] This is how the matter was put to the respondents: “Queensland has the second fastest growing population in Australia and around 2000 people move to Queensland every week. Current forecasts predict Queensland’s population of 4 million could double to 8 million in less than 50 years. Much of this growth is projected to occur in South East Queensland. Growth in the population comes through overseas and interstate migraiton as well as natural increase.” (p.22.)
[4] The report described the total responses to abstract questions on population growth as “slightly more against population growth than for it, but close to 50:50.” There was an attempt to put a decent gloss on things: “Overall, the weight of opinion about population growth effect on SEQ (South East Queensland) is slightly unfavourable.” (Mean rating of 47.4 out of 100, where zero is ‘terrible for SEQ’ and 100 is ‘great for SEQ’.”) (p.21) However subsequent questioning showed most people strongly disliked population growth.
[5] Responses to unprompted questions on negative and positive aspects of population growth: 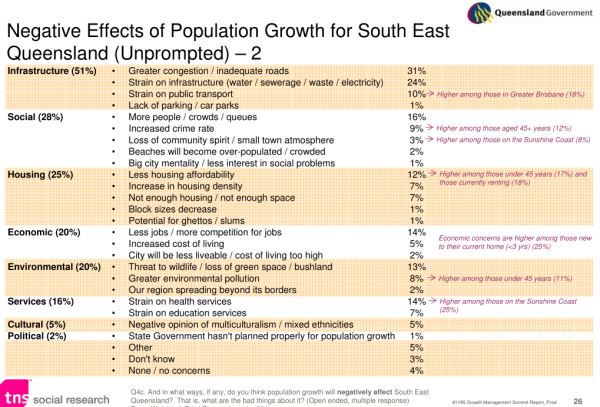
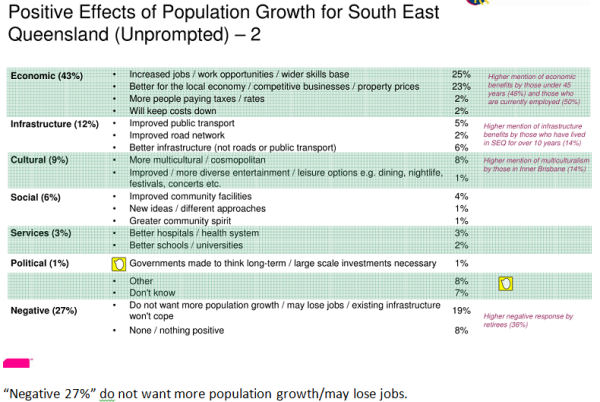
[6]The publisher of On Line Opinion recently changed its name to The Australian Institute for Progress, as "part of a major change in direction for the organisation". Although they intend to "continue to publish On Line Opinion", they have announced that their "major work will be policy development." (Source: http://www.onlineopinion.com.au/display.asp?page=membership)

Comments
anon (not verified)
Wed, 2015-12-09 10:21
Permalink
People don't link the impacts of population growth to it's cause
Sheila Newman
Tue, 2021-06-01 21:10
Permalink
John Quiggin, "Lower birthrates may just be the tonic we need"
Add comment