 What gives with surveys that tell us that most of us want more immigrants and a bigger population when, all around us, we suffer the effects of faster and faster population growth in groaning infrastructure, costly housing, road congestion, and rising costs for power and water? If we examine such studies, we will find that they pose their questions in the abstract and do not prompt people to make concrete associations about the effects of immigration and population growth. This is a bit like asking people how they feel about war compared to asking how they feel about war in their suburb. These polls also focus on ethnicity of immigrants rather than environment and planning impacts of mass migration. This article looks at recent polls by the Australian Institute of Progress, Roy Morgan Research, the Australian Election Study and Queensland Growth Management Summit 2010, Social Research on Population Growth and Liveability in South East Queensland". The Queensland survey is the most detailed and valid and has been discussed in its own article, "Poll shows most hate population growth: Lessons from Queensland in polling reliability and interpretation."
In 2013 the Australian Election Study found that only 24% of Australians supported higher levels of immigration. It received 3,955 valid responses from an initial sample of 12,200 people. The survey is conducted on paper via snail-mail or online. There are prizes to motivate timely responses. [1] This survey is known as Australia's biggest and most reliable, but, as the table below shows, its response rate has been falling every year.
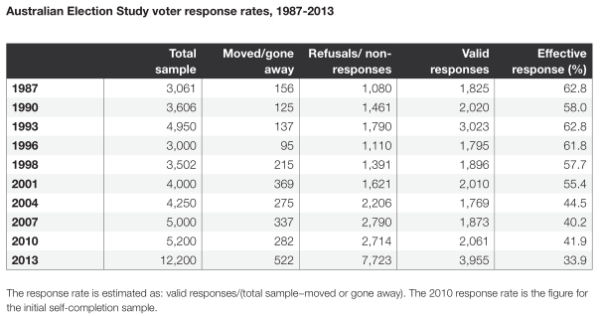
Responses to telephone polls, however, are an order of magnitude dimmer, at 9-17%. This is the method that the Roy Morgan institute uses. The Australian Institute of Progress uses on-line surveys of a particular population it has gathered over the years, but that population cannot be said to represent the average Australian's point of view.
On October 15, 2015 the Australian Institute of Progress (AIP)came out with [usable] poll results from 1349 people which it claimed showed that 69% of those polled supported higher immigration. The poll received inordinate publicity from a mass media eager to promote rapid population growth in Australia, [2] with The Australian interpreting the result to mean that "69 per cent of Australians support high rates of immigration."
On October 20, 2015, Roy Morgan also came out with poll results from 650 people: A majority of Australians support higher immigration and an Australian population over 30 million. This predictably also received huge publicity in the mass media.
Claims that most Australians suddenly support higher immigration [3] and an Australian population of over 30 million are hard to take on face value, especially in the light of the results of the Queensland survey: "Queensland Growth Management Summit 2010, Social Research on Population Growth and Liveability in South East Queensland", March 2010 [4], a probed survey with 801 respondents which showed that about 90% experienced population growth as having a negative impact on their lives. My experience between 1994 and 2015 (the period I have been studying attitudes to population growth) is that more and more people are speaking out against the many effects of high immigration and rapid population growth. That's not surprising, since the effects have been more and more noticeable as the population has grown more and more rapidly.
So I took a look at the questions, the numbers and the method in the AIP and the Roy Morgan polls.

Why would most Australians tick a box for a population over 30 m but less than 35m in the Roy Morgan poll?
"A majority of Australians support higher immigration and an Australian population over 30 million."
I find it interesting that the respondents in this poll apparently endorsed 'under 35 million' but did not endorse '35 million or more', and did not choose 'Under 30 million'. How did they make such a distinct choice? How were the population number choices proposed?
This is how the Roy Morgan poll posed the question of population size:
“Australia’s population has increased by 6 million from 18 million to 24 million over the last 20 years. What population do you think we should aim to have in Australia in 30 years – that is, by 2045?”
Under 25 million 9%
25 - Under 30 million 23%
30 – Under 35 million 27%
35 – Under 40 million 16%
40 – Under 50 million 10%
50 million or more 4%
Can’t say 11%
There are a number of things I find odd about these responses and the interpretations made.
Why, for instance, did more people not select the last three options, if they want a bigger population? The choice of 30m or no more than 35m does not signal enthusiasm for a big population; rather a desire to remain at the lower end of the scale they were presented with as the choices. How, I wonder, did they make these choices? Were they under the impression that what they were selecting was either mathematically reasonable or appeared more 'generous'? Or, given the historic growth described as going from 18 m to 24m in 20 years, did they assume some arithmetical trend of six million every 20 years, and therefore a sequence of 18:24:30? Which would mean that they stopped at the lowest possible logical number sequence?
My own experience of talking to people about population numbers, including conducting polls at the Sustainable Living Festival, is that many have only the faintest idea of what Australia's population is now, or the world's. They seem to be unable to quantify or imagine these numbers. 24m might mean little to them. The rates of population growth that the Roy Morgan poll gave them as historical examples are abnormally high, due to mass immigration, and atypical of normal (naturally established) populations. Few Australians, however, would realise how unusual Australia’s population growth rates have been.
Social desirability bias
Also, given how wanting lower immigration is stigmatised by the mass media and the government, which tend to conflate invited economic immigration with refugee or asylum-seeker migration, and protests about Muslim immigration as racist, it is likely that responses may have been affected by social desirability bias. Which would mean that this Roy Morgan poll would have been measuring what people have been taught is acceptable opinion rather than what they really think.
In an era of electronic surveillance, increased identity theft, phone scams and home invasion, how many people are likely to freely give an honest personal or political profile to some anonymous inquirer on the phone?
Although I also asked the Roy Morgan polsters a question about the use of randomized phone numbers, phone polls, the size of the group, and whether they used this same group size for their election polls, Roy Morgan did not get back to me.
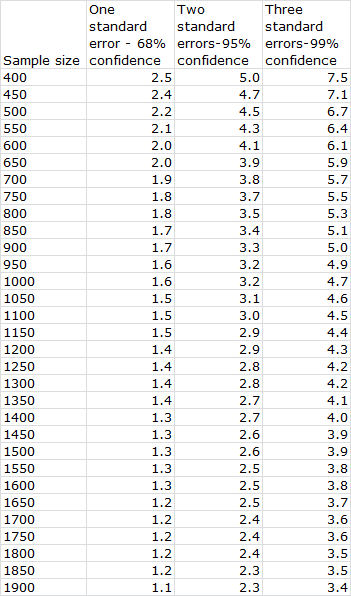
My understanding is that Roy Morgan polled a group of 650 people. This size group has a relatively high standard error.[5] The responses could be quite misleading.
The Roy Morgan polls were conducted by phone. A huge proportion of people select out of answering phone polls these days. As mentioned above, the response rate is something between 17 and 9 %. Although professional polling groups do studies on the huge and increasing refusal rate in phone polling, they usually conclude that this doesn’t make much difference. They base this conclusion on finding that small phone respondent groups have similar characteristics to larger groups of respondents to other methods, however the characteristics explored are not deep.
If survey groups revealed that their survey methods were very unreliable, they would go out of business. Think of your own reactions to phone surveys. In an era of electronic surveillance, increased identity theft, phone scams and home invasion, how many people are likely to freely give an honest personal or political profile to some anonymous inquirer on the phone?
Social desirability bias risks:
The responses the Morgan poll obtained were in accord with mainstream media propaganda which manufactures consent, rather than informs. The Australian mass-media and government consistently endorse high immigration and stigmatise as racist or ungenerous people who do not want high immigration. In polling there is a strong problem of social desirability bias, where people do not like to reveal to the polster that they hold views that vary from what perceived authorities deem desirable. This is particularly so on sensitised issues and the issue of immigration is strongly sensitised in Australia. In the Roy Morgan poll, the population growth question came after the survey group had been softened up by the immigration questions.
Misleading and vague
Although the survey informed people of approximately the numbers of [planned invited economic] permanent immigrants in 2014-2015, it did not mention the rate of temporary immigration nor the rate of conversion to permanent whilst in Australia, which comes to a much higher number. Nor did it mention that over 60 per cent of Australia's population growth comes from overseas immigration. There was no information about the recent high annual rate of growth of Australia’s population compared to that of other comparable OECD countries. Most people would not be able to tell you what that would mean in terms of doubling time anyway. Basically, there was no way for people to judge whether Australia’s population growth rate was normal or extreme. The survey questions lacked context and personal relevance.
What was the poll actually measuring?
The Roy Morgan poll did not establish that those surveyed actually knew the facts on what they were agreeing or disagreeing with. How valid were the responses in regards to population size and immigration? What did the poll actually measure? Impressions that immigration and population were 'under control' could be based on erroneous beliefs, such as that most immigrants are refugees, 'boat people' or asylum seekers; that the government has reduced this inflow, leading to the erroneous conclusion that Australia is getting hardly any immigrants and that the population may not be growing much at all from overseas immigration. Although you would think that people could work the situation out by looking at the growing traffic congestion, the fact is that, if asked a question about population or immigration without any prompting about congestion or housing shortages, for instance, most people do not make that connection.
Australian Institute of Progress Survey into Australian Community Attitudes to Immigration
The Australian Institute of Progress Australian Attitudes to Immigration reported that 69 per cent of its respondents were in favour of current or higher levels of immigration versus 27% who wanted less than current levels. (Table 1). But the institute admitted that
"Our percentages are not necessarily representative of the wider community with the same question in a poll commissioned by the Q Society finding 40.8 per cent thought that it was good. This is a significant discrepancy that we cannot explain." AIS, p. 6.
The Australian Institute for Progress's poll of 1349 respondents, from a non-random survey, gave similar results to the randomized Roy Morgan one, but it also asked questions which showed that a large proportion of those surveyed who agreed with higher immigration intake probably thought that most immigrants were refugees or asylum seekers, and may well have believed their numbers were less than 20,000 per annum, unaware of the far greater numbers of planned invited economic permanent immigrants, numbering around 250-300,000 per annum, or of short term immigrants.
The AIP Australian Attitudes to Immigration poll asked people for comments about the reasoning behind some of their answers and threw up plenty of misunderstandings indicating poor information about numbers and kinds of immigration to Australia. Few people seemed to understand that immigration increased population numbers and that this would affect their lives:
"The refugee issue affects what comes to mind when people talk about immigration. They often seem unaware that Australia is running a substantial non-refugee immigration program amounting to hundreds of thousands a year." (p.8.) "Many of those favouring an increase in immigration think that Australia takes far fewer immigrants than most other countries. (This is objectively wrong as can be seen in a comparison of net migration for all countries complied in the CIA factbook and available at "https://www.cia.gov/library/publications/the-world-factbook/rankorder/2112rank.html). (p.8.) [...] "Many of the respondents conflate immigration with the refugee issue." (p.12).
People opposed to immigration seemed to understand more about its role in population growth and how this would affect their lives:
"Those who are opposed to immigration are most likely to cite stress on infrastructure, housing, or the employment market." Australian Attitudes to Immigration, (p.10).
The Australian Institute of Progress does not claim that its results were for an average of Australians. Graham Young, Executive Director of the Australian Institute of Progress Poll told me in an email,
"[...] the survey sample has grown organically over the years. We picked-up a lot of respondents from the Australian newspaper at one stage. The ABC audience has also been a heavy contributor, and various parties have probably tried stacking it over the years. When I’ve done surveys of their media usage most don’t appear to use OLO. The largest single group of respondents seem to be Greens [...] [...] We did use other quantitative surveys as controls to ensure we weren’t too far out of whack." [6]
Mr Young sent me a report about the Morgan poll, suggesting that its similar results bore out the reliability of the Australian Institute of Progress poll. I would have thought the opposite, however, because, if the Morgan poll was adequately randomized and numerous as it claims, it should not agree with the Australian Institute of Progress poll, which surveyed a population probably dominated by refugee-focused Greens, with a dash of right-wingers from The Australian, some ABC viewers and lacking working class people.
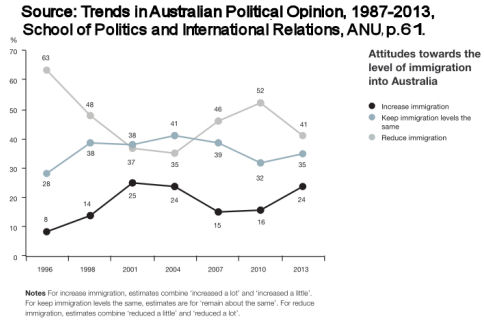
Young compared the Australian Institute of Progress Poll to the much wider based 2013 Australian Electoral Study (mentioned near beginning of this article) which does include the ‘working class’ which last year showed very different results from the AIP ones. (See graph at beginning of this article.) The Electoral Study results were that only 24% favoured an increase in immigration, while 41% favoured a decrease and 35% favoured no change.[7] The 2013 Australian Electoral Study also posed its questions as abstract concepts.
For a quite different picture from those provided by Roy Morgan and the AIP, read about the prompted perception of impacts of population growth in South East Queensland, 2010 survey by Queensland Government. There are many reasons to argue that the Queensland survey method was an order of magnitude more valid than the other polls discussed above.
NOTES
[1] From the 2013 survey at http://ada.edu.au/ADAData/questionnaires/ADA.QUESTIONNAIRE.01259.pdf
"Completing the survey
This survey should take around half an hour to complete and your participation is entirely voluntary. If
you choose to participate, you can complete online by going to www.srcentre.com.au/aes and follow the
links. To access this survey you will need the username and password located in the panel in the top
right hand corner of this page. Alternatively, you can complete and return this questionnaire in the reply-
paid envelope provided. Respondents who complete the Australian Election Study early and return the
questionnaire by 26 September 2013 will be entered into a prize draw to win $500 cash. In total 3 x $500
will be drawn. For those who complete and return the questionnaire by 25 October 2013 you will also be
entered into a prize draw to win $500 cash (refer to prize draw terms and conditions of entry at
www.srcentre.com.au/aes). To assist you there are some instructions before the beginning of the
questionnaire about how to fill it out. Remember, it is important that we get your personal views on the
issues outlined in the questionnaire as well as some general information about yourself.
Confidentiality
Your views will remain strictly confidential and will be reported only as part of the general findings from
the survey. The only identifying feature on the questionnaire is a barcode which is used to avoid sending
you reminders after you have returned the completed questionnaire. The link between this barcode and
your name and address is securely stored and is destroyed once the survey is completed."
[2] Saskia Edwards, "Australians deeply divided on immigration policy," 13 October 2015 and "Australia divided on migration issues", The Australian, 13 October 2015.
[3] “Today 57% (up 22% since July 2010) of Australians support an Australian population of over 30 million in 30 years’ time – a stunning increase from only five years ago. Only 9% (down 15%) support a population of under 25 million, a further 23% (down 9%) support a population of 25-30 million and 11% (up 2%) can’t say.
A clear majority of Australians 69% (up 11%) support immigration (of 210,000 in 2013/14) remaining the same 37% (down 10%) or increasing 32% (up 21%) while 26% (down 14%) want immigration levels reduced and 5% (up 3%) can’t say.
Importantly, more Australians believe immigration has a positive effect on Australia 37% (up 4%) than a negative effect 31% (up 1%) while 19% (down 2%) believe immigration has little effect and 13% (down 3%) can’t say according to a special Morgan Poll conducted over three nights last week with a cross-section of 647 Australians aged 14+.
Not surprisingly, a vast majority of Australians support both Skilled migrant immigration (89% cf. 8% oppose) and Family reunion migration (79% cf. 16% oppose).
In addition, the negative debate about Muslims and Asylum seekers has had little impact on how Australians consider these types of migration – 65% of Australians support Muslim immigration up from 54% support in July 2010, while 28% of Australians oppose Muslim immigration.
A large majority of Australians support Asylum seeker immigration (71% up from 52% support in July 2010) while 21% of Australians oppose Asylum immigration.”
[4] For a sample size of 650 people, one standard error would be 2.0; two standard errors would be 3.9 and three standard errors would be 5.9.
To calculate the standard error take the square root of the following sum: the proportion you are interested in multiplied by the proportion of all the rest divided by the sample size.
The smaller the 'standard error', the more reliable the measure. Multiplying by 2 and 3 to get two and three etc standard errors is based on a theoretical second and third sample, and applies some kind of standard deviation norm which gives you the reliability.
Reference: D. A. de Vaus, Surveys in Social Research, Allen and Unwin, Sydney, Allen and Unwin, 1995, pp. 151-2.
[5]
"[...] the survey sample has grown organically over the years. We picked-up a lot of respondents from the Australian newspaper at one stage. The ABC audience has also been a heavy contributor, and various parties have probably tried stacking it over the years. When I’ve done surveys of their media usage most don’t appear to use OLO. The largest single group of respondents seem to be Greens [...] [...] We did use other quantitative surveys as controls to ensure we weren’t too far out of whack." (Source: Email from Graham Young dated Sat, Oct 17, 2015 at 11:56 AM.)
[6] “Our respondents are likely to be more strongly in favour of continued migration than the bulk of the population, as the 2013 Australian Electoral Study shows 59% favouring current levels or higher, and 42% favouring lower levels. This probably reflects the fact that our surveys miss working class Australians. (Table 1).” Source: http://aip.asn.au/wp-content/uploads/2015/10/151013-AIP-Australian-Attitudes-to-Immigration-Report-FINAL.pdf, p.5.
[7] Here are the questions from the 2013 Australian Electoral Study that contain some relevance to population polls. You can download a copy of the study from: http://politicsir.cass.anu.edu.au/research/projects/electoral-surveys/australian-election-study/aes-2013
- Here is a list of important issues that were discussed during the election campaign. When you were deciding about how to vote, how important was each of these issues to you personally?
Issues Extremely important Quite important Not very important
1. Taxation ............................................ 1 2 3
2. Immigration ....................................... 1 2 3
3. Education .......................................... 1 2 3
4. The environment ............................... 1 2 3
5. Industrial relations ............................. 1 2 3
6. Health and Medicare ......................... 1 2 3
7. Refugees and asylum seekers .......... 1 2 3
8. Global warming ................................. 1 2 3
9. The carbon tax .................................. 1 2 3
10. Management of the economy ........... 1 2 3
- Still thinking about these same issues, whose policies—the Labor Party’s or the Liberal–National Coalition’s—would you say come closer to your own views on each of these issues?
- Still thinking about the same 10 issues, which of these issues was most important to you and your family during the election campaign? And which next?
Please put the number of the issue in the appropriate box below
Issue of most concern .............. Second issue of concern .............
- What do you think is the best way to handle the processing and resettlement of asylum seekers who come by boat and manage to reach Australian waters?
Process and resettle offshore .................................................................... 1
Process offshore but resettle in Australia .................................................. 2
Process and resettle onshore in Australia ................................................. 3
None of these options ................................................................................ 4
- Here are some statements about general social concerns. Please say whether you strongly agree, agree, disagree or strongly disagree with each of these statements.
The death penalty should be reintroduced for murder .....
The smoking of marijuana should NOT be a criminal offence
People who break the law should be given stiffer sentences
Women should be given preferential treatment when applying for jobs and promotions
All boats carrying asylum seekers should be turned back
Same-sex marriages should be prohibited by law
White Australians are advantaged over others in applying for jobs
It’s a problem if people think of themselves mostly as members of ethnic groups rather than as individuals.
The government should increase opportunities for women in business and industry
- Do you think the number of immigrants allowed into Australia nowadays should be reduced or increased?
Increased a lot ........................................................................................... 1
Increased a little ......................................................................................... 2
Remain about the same as it is ................................................................. 3
Reduced a little .......................................................................................... 4
Reduced a lot ............................................................................................. 5
- There are different opinions about the effects that immigrants have on Australia. How much do you agree or disagree with each of the following statements?
Strongly agree Agree Neither agree nor disagree Disagree Strongly disagree
Immigrants increase the crime rate ..... 1 2 3 4 5
Immigrants are generally good for Australia's economy ............................ 1 2 3 4 5
Immigrants take jobs away from people who are born in Australia ........ 1 2 3 4 5
Immigrants make Australia more open to new ideas and cultures .......... 1 2 3 4 5




 Dick Smith queries Lucy Turnbull’s Perpetual Population Growth Plan. In a half page advertisement featuring in major newspapers tomorrow morning, including the Daily Telegraph in Sydney,
 During the 2015-2016 financial year, more than 2600 health workers were brought into Australia via government-sponsored 457 visas on the basis they were needed for jobs that could not be filled by Australians. Of these 1692 were general practitioners and resident medical officers, 228 registered nurses, 35 specialists, 38 psychiatrists, 28 surgeons, 19 anesthetists and 20 midwives.
 Referring to the HILDA Report, the author suggests that, if immigration were reduced, a precipitate decline in house-prices could probably be adequately buffered by local buyers who currently cannot afford to enter the grossly inflated housing market.



 People often ask me why I campaign on population and the reason that I give is that it is an issue that is often overlooked by the environment movement and by the wider world at large. I feel that by ignoring this topic, so much of the other great work done by environmentalists and campaigners is in danger of being severely compromised. Rapid population growth is a worldwide issue and it is also an issue here in Australia. One reason for this is because Australia has one of the highest migration rates in the ‘developed’ world. Due to the way our infrastructure is distributed this is a major reason why an average of 1760 people are added to the population of Melbourne every week and 1600 are added to Sydney. (More by Mark Allen at
 Sustainable Australia says the Turnbull Government has no chance of making good on the Prime Minister’s announcement that he wants to build so called “30 minute cities”, where everything people need is within a 30 minute commute. Sustainable Australia’s Senate candidate in NSW, William Bourke, says that the Prime Minister’s vision of a congestion free future is delusional, while immigration continues to run at record levels.

 Geoff Dowsett writes that he received a pathetic response from the Greens re

 Dear Minister Dutton.

 Andrew McNamara is former Minister for Sustainability, Climate Change and Innovation in Queensland. He argues here that the Sustainable Population Party (soon to become the Sustainable Party) was the real winner of the North Sydney by-election; that all other participants showed diminishing or one-off results.
 What gives with surveys that tell us that most of us want more immigrants and a bigger population when, all around us, we suffer the effects of faster and faster population growth in groaning infrastructure, costly housing, road congestion, and rising costs for power and water? If we examine such studies, we will find that they pose their questions in the abstract and do not prompt people to make concrete associations about the effects of immigration and population growth. This is a bit like asking people how they feel about war compared to asking how they feel about war in their suburb. These polls also focus on ethnicity of immigrants rather than environment and planning impacts of mass migration. This article looks at recent polls by the


 What can we believe about mass-media reported surveys that give us counterintuitive information about how we are supposed to feel about high immigration and population growth? This article concludes that we need to check with each other, rather than rely on what the press 'reports'.
 The publisher of On Line Opinion recently changed its name to The Australian Institute for Progress, as "part of a major change in direction for the organisation". Although they intend to "continue to publish On Line Opinion", they have announced that their "major work will be policy development." (Source:
  In 2005 John Howard had been Prime Minister for nearly a decade and didn't look particularly vulnerable. But then he decided to ramp up Australia's migration intake. Net overseas migration jumped from the 100,000 it had been in 2004 to over 200,000 in just a couple of years. In 2005 migration overtook natural increase as the dominant driver of population growth, and we entered an era of rapid population growth, which we are still in. Our population now increases by a million people every three years.
 The era of rapid population growth has also been one of great political instability. John Howard lost the 2007 election and indeed lost his own seat. His successor, Kevin Rudd, maintained and even increased net migration. When he was questioned about rapid population growth in 2009 he declared he was in favour of a Big
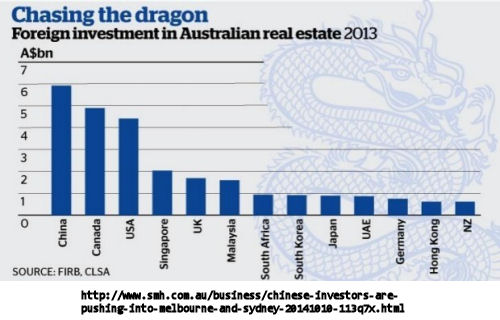
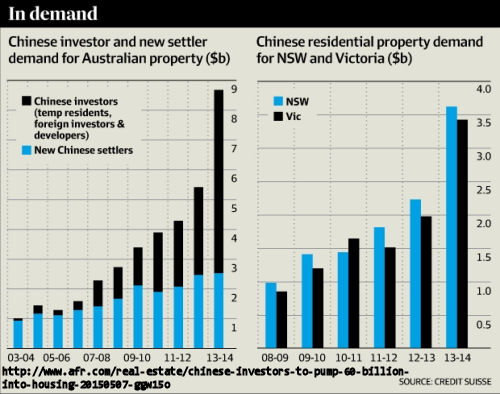
 (Video inside.) Once again Nick Folkes and his Party for Freedom have come up with a very effective way to protest against foreign ownership and overpopulation through invited economic immigration and its impacts.[1] Other groups would do well to imitate these democratic initiatives especially if they differ with Party for Freedom on issues of multiculturalism but care about housing affordability and democracy, rather than simply trying to shut Party for Freedom up and, in the process, allow the growth lobby to destroy Australia. In this video Folkes and his Party continue their campaign to make real estate agents and property developers think twice about selling built property to foreign nationals. They focus on the preponderance of Chinese foreign nationals purchasing Australian property. This cannot help but get attention since the Australian mainstream media constantly popularises this issue, although it does not promote any effective way of countering it. (Note that Fairfax and Murdoch press are heavily invested in property dot coms that market Australian real estate to the world: www.realestate.com and www.domain.com). In the video inside this article Mr Folkes engages effectively with people who show both positive and negative interest in the protest for which he is a spokesperson. What next, Mr Folkes, a protest at an Australian international airport, or on the road towards it?
 I am a member of the Hornsby Kuringai Greens, NSW and a member of the Greens Population/Sustainability Working Group. On July 18 I emailed all Senate NSW pre select candidates to ask them what they would do, if elected to the Senate, about Abbott's high population growth position, with reference to immigration, 457 visas, and growth economy addiction. I received encouraging responses back from Amanda Findley and Brad Orgill. Whilst I, like many, think it would be a great loss not to have Lee Rhianon in the Senate. She was almost frightening when she hammered home the seriousness of what we are facing with Abbott: TPP, giant coal mines etc., attack on renewable energy; but she won't budge on her position regarding population and immigration. I had a chat with her and James Ryan later and her point was that we are going to be facing thousands of people from the Pacific Islands who have been washed out of their homes by sea level rise and increasing storm frequency and intensity so how can we argue against the current rate? Also she seemed to be saying that it's too complex because of global population reality etc. Below I have published the responses I received to my Population/Immigration/addicted to growth Economy concerns.
 Dear Greens Senate NSW pre select candidates.

 The policy and position of Australian government with respect to population issues is the most influential factor likely to impact on Australia’s future sustainability and hence the prosperity of current and future citizens. Because of the bipartisan government position on population/immigration numbers it is all but impossible to engender an effective public debate on these issues. I therefore welcome this opportunity created by the Productivity Commission to have this debate in a manner that is untarnished by vested interests and scaremongering about perceived xenophobia.


 Update: See note [1] on where candobetter.net's values differ from those apparent on Party for Freedom site. John Ajaka, the NSW Minister for Multiculturalism's
  The multicultural cloak has been given unmerited authority and power by vested interest and protection from political figures. Nick Folkes is a working man attempting to lead protests against mass dispossession of Australian citizens by virtually unregulated foreign property buyers who are outbidding Australians and contributing to an overpriced Australian housing market.

 Big Australia, or big anywhere, is a contentious issue. The population ponzi scheme is a concept the public appear to find noxious. There's no votes in packing more sardines into the Australia can. Aware of this, sniveling politicians have often schemed a way to get the public to focus on their rhetoric and ignore their government's ever increasing immigration numbers. [This incisive and witty article has been republished with permission from
  Take war monger and lying rodent, John Howard. During his time in office, Howard more than doubled the immigration intake. Hilariously, immigration also pumped from those Sandrockistan countries that truly agitate 58 year old disability pensioners, bereft of hope, who while away their days ranting on Larry Pickering's blog. The exact group who continued to vote Howard into power because he told them, "we will decide who comes to this country and the circumstances in which they come."
 The function of Australian mass media seems to be to inveigle listeners into complicity in the terrible transformation that is being visited on us in Australia (turning what were once pleasant capital cities where most of us now live, into dystopian megalopolises) by inviting them to 'choose' between distasteful solution A or unpleasant solution B.
 ACOSS has come to the amazing and unprecedented conclusion that for "an increasing number of Australians, housing affordability is a serious problem that affects their ability to work". A quarter of people battling with housing stress regularly skip meals in order to pay their rent.
 Linking population growth with productivity and labour participation is problematic, just one of many questionable assumptions made in the Intergenerational Report. Author Dr Katharine Betts is Adjunct Associate Professor of Sociology at Swinburne University of Technology. Article first published at

 Ref: RN Breakfast interview with Joe Hockey on 26 February 2015
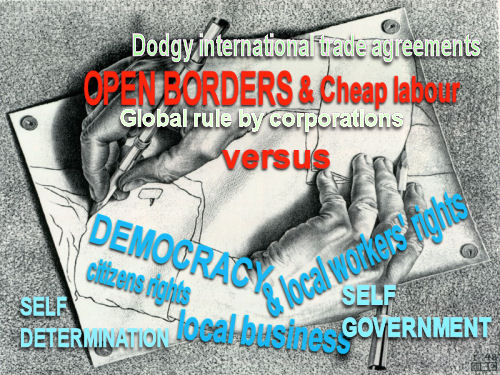
  Migration is hardly a solution to world poverty and conflict, but the mainstream media predictably push this line. Even the Guardian, for all its purported democratic values, continuously pushes for open borders without disclosing that these also facilitate a right-wing agenda for cheap imported labour sources and the crushing of local industry and employment. Its recently issued 'special report' entitled, "Hardline Australia, confused Scandinavia and tense Russia: the global immigration picture"
 "This issue is not the cost of building nor dwelling sizes, but the economic and political conditions which are fuelling the bubble. Policies which promise to build low cost modest housing, or any policy which increases density will only drive prices higher and worsen the situation. By reducing dwelling size, the premium paid for land increases and land price increases. After all, the bulk of the cost is the land, as houses can still be built for under $200,000. The high land price due to flooding the market with credit and speculation, not the size of the houses built. So reject any policy about increasing density or providing smaller "more affordable homes". [...] In the current climate the only result of making dwellings smaller, is to make people take $600,000 loans for 2 bedroom units instead of three bedroom houses. The market will simply price the smaller properties at the same price as the larger ones they replaced."
 Sustainable Population Australia (SPA) today called on the Federal Government to undertake a complete review of immigration into Australia in light of claims of widespread rorting of the system.
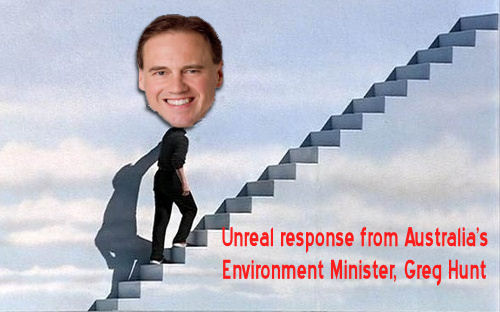
 On the 13th of May Environment Minister Greg Hunt purportedly answered a simple question about Australia's dangerous and undemocratic population growth put to him by Kelvin Thomson. Minister Hunt's response should be a source of great concern for all Australians. It shows no respect for the very serious consequence to democracy or the environment of continuous population growth. The response is cavalier and disrespectful to Australians who have major and justifiable concerns on this matter. Below we quote the short dialogue in Hansard, and then we publish two observant comments about the Minister's failure to take the question seriously.
 The Maritime Union of Australia (MUA) is seeking all members sign our petition (below) to lobby the Senate to oppose the Abbott Governments efforts to open the door for cheap foreign labour in the offshore sector. The Federal Liberal Party want to repeal legislation designed to protect Australian offshore workers and introduce MCV Visas. Under the MCV visa laws, there are no requirements for employers to demonstrate the unavailability of Australian workers. Australian workers will be left on the beach whilst cheap, subservient foreign workers take our jobs. There are no minimum rates of pay or conditions of employment. There will be a free for all.


 Illustration photo is used by a real agency.
Recent comments